SPM-8100FM - Applications
High-Resolution Scanning Probe Microscope
In Air
The Molecular Structural Arrangement of a Thin Film of Lead Phthalocyanine Crystals
These figures show phthalocyanine crystals, which are commonly used in organic light-emitting displays, and in dye-sensitized solar cells. The four-leaf structure surrounding the metal atom at the center of the molecule can be clearly observed.

Sample: PbPc/MoS2
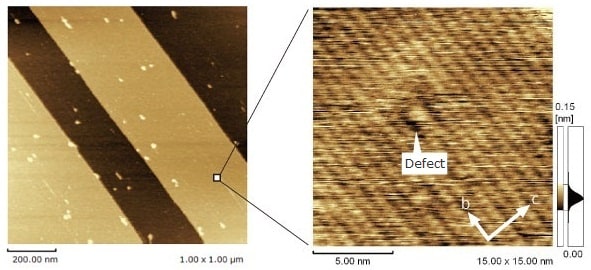
Atomic Defects in Polydiacetylene Crystals
Observations were made of polydiacetylene crystal surfaces, cleaved in air. If the terrace observed in the wide-area image (in the figure at left) is enlarged, individual PTS (para-toluenesulfonate) side chains lined up at 0.5 nm intervals can be observed along the main diacetylene chain, running at 0.75 nm intervals parallel to the b-axis. The fact that an atomic defect is visible is evidence that the image is of an actual space, not a FFT image of periodicity.
In Liquid
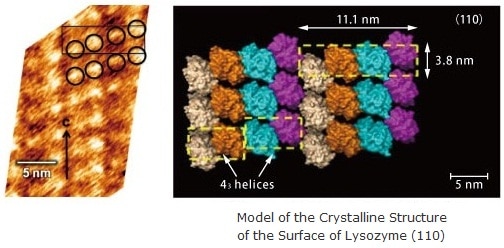
Molecular Structure of Proteins 1)
Egg-white lysozyme was observed in a saturated aqueous solution. Protein molecules (the circles in the figure at left) can be observed within the surface unit cell (the square in the figure at right)..
Mixed Crystalline Structures
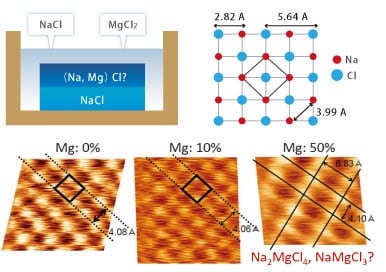
This illustrates the observation of epitaxially-grown Na2MgCl4 crystals on a single NaCl crystal surface in a mixed solution.
Because the crystalline structure can be observed, this technique can be used to identify the structure of mixed samples.
Atomic Structure of a Calcite Cleavage Plane 2)
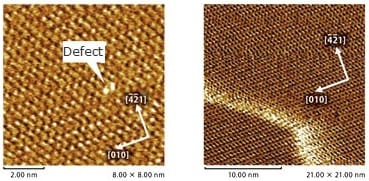
This is an atomic-resolution observation of surface structure in a liquid medium. Defects in the calcite surface are evident in the figure at left.
Cited References
- K. Nagashima, M. Abe, S. Morita, N. Oyabu, K. Kobayashi, H. Yamada, R. Murai, H. Adachi, K. Takano, H. Matsumura, S. Murakami, T. Inoue, Y. Mori, M. Ohta, R. Kokawa, Molecular resolution investigation of tetragonal lysozyme(110) face in liquid by FM-AFM, Journal of Vacuum Science and Technology B 28 (2010) C4C11-C4C14
- Sebastian Rode, Noriaki Oyabu, Kei Kobayashi, Hirofumi Yamada, and Angelika Kuhnle, True Atomic-Resolution Imaging of (1014) Calcite in Aqueous Solution by Frequency Modulation Atomic Force Microscopy, Langmuir, 2009, 25 (5), pp 2850–2853
* All data on this page was obtained using the petri dish type solution cell (option).
Observational Examples of Hydration/Solvation Structure
What are Hydration and Solvation?
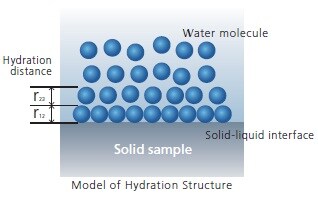
It is known that liquids in contact with solids become stratified, a phenomenon called solvation, or in the case of water, hydration. It is believed that this characteristic structure, which is different from that of a bulk liquid, is the main influence on the various roles played by solid-liquid interfaces, such as dissolution, chemical reactions, charge transfers, wetting, lubrication, and heat transfer in the liquid phase. However, because this layer is extremely thin, the hydration/solvation structure is not easy to measure experimentally. In particular, non-uniform structures in the in-plane direction of the surface have not yet been detected.
Differences from Existing AFM Technology
When measuring hydration/solvation, the variation in the force on the cantilever is very small. However, by using an ultra-high sensitivity FM method, this can now be measured for the first time.
Such methods enable not only the measurement of hydration/solvation structures in the Z-X direction, but also the analysis of 3D Z-XY structures. HR-SPM capabilities have now advanced from mere surface observations to measurements of the structure of solid-liquid interfaces.
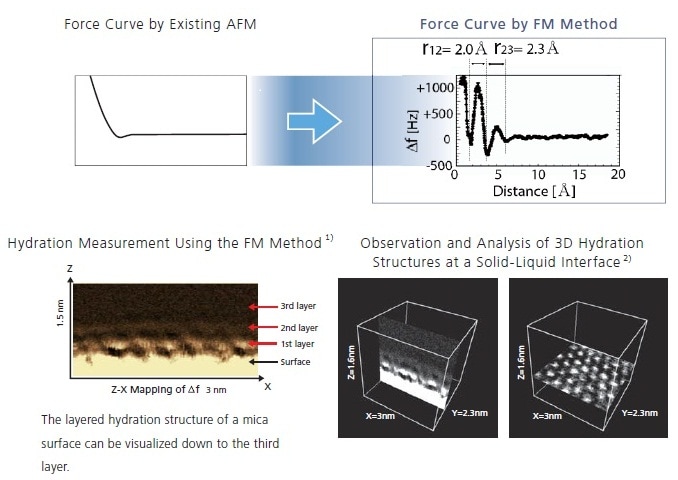
Hydration/Solvation Measurement Method
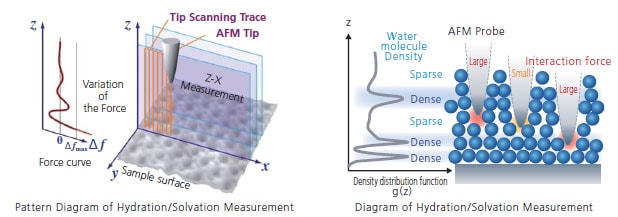
- Run the HR-SPM in a solution, bringing the cantilever close to the surface of the solid sample with high precision, up to the settings value (≠fmax).
- Use the force curve method to measure the force on the probe on the tip of the cantilever.
- Variations in characteristic power (Δf) in accordance with the sample can be obtained in the immediate vicinity of the solid-liquid interface.
- Variation of the force is due to hydration/solvation, which provides insight into the stratification structure in the liquid.
- A cross section of the hydration/solvation structure can be visualized by performing continuous acquisition in the X-direction (Z-X measurement).
- Furthermore, the 3D structure of the solid-liquid interface can be analyzed by acquiring Z-X measurements in the Y direction.
Data Analysis Software
This software is designed specifically for 3D mapping data analysis. It provides powerful support for analyzing hydration and solvation structure data.
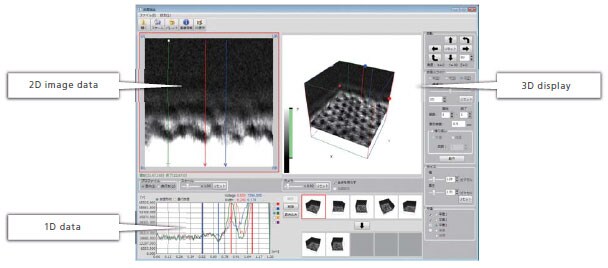
- Displaying 3D mapping data
- Extracting and displaying 2D images from the mapping data
- Displaying and analyzing specified 1D data over 2D image data
Examples of Hydration/Solvation Structure Measurements
Interface Structure of 1-Decanol Contact with Graphite
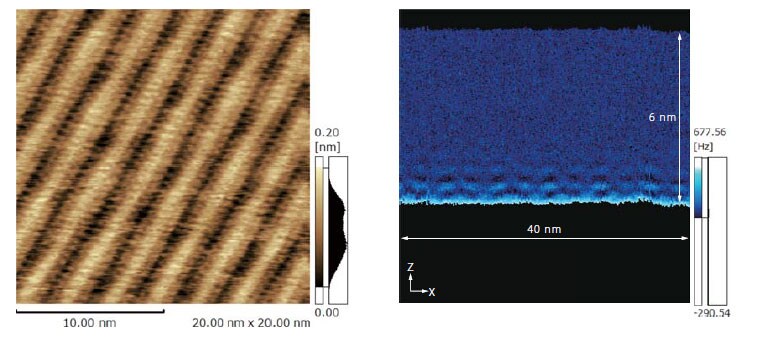
The molecular film of 1-decanol over graphite was observed (figure at left). The joining of two molecules of decanol and molecular film formation can be observed. The cross-section structure of decanol liquid contact with an adsorbed molecular layer was measured (figure at right). It was found that the decanol organized in a layer structure and there existed inhomogeneous distribution in an in-plane direction.
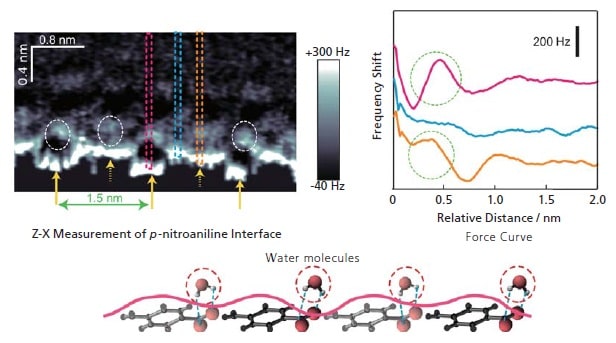
A Saturated Aqueous Solution in Contact with p-nitroaniline Crystals 6)
In the Z-X in measurements on the left, the convex area is the position of the benzene ring, and the concave area is the position of the hydrophilic functional group. From the force curves at each position (Z-Δfcurves), it is evident that there is strong hydration due to the localization of water molecules in the concave area representing the hydrophilic group. This data suggests that the structure is stabilized by hydrogen bonding of the water molecules with the polar groups, as shown by the model in the figure at the bottom.
Cited References
- Ryohei Kokawa, Masahiro Ohta, Akira Sasahara, Hiroshi Onishi, Kelvin Probe Force Microscopy Study of a Pt/TiO2 Catalyst Model Placed in an Atmospheric Pressure of N2 Environment, Chemistry – An Asian Journal, 7, 1251-1255 (2012).
- K. Nagashima, M. Abe, S. Morita, N. Oyabu, K. Kobayashi, H. Yamada, R. Murai, H. Adachi, K. Takano, H. Matsumura, S. Murakami, T. Inoue, Y. Mori, M. Ohta, R. Kokawa, Molecular resolution investigation of tetragonal lysozyme(110) face in liquid by FM-AFM, Journal of Vacuum Science and Technology B 28 (2010) C4C11-C4C14
- Sebastian Rode, Noriaki Oyabu, Kei Kobayashi, Hirofumi Yamada, and Angelika Kuhnle, True Atomic-Resolution Imaging of (1014) Calcite in Aqueous Solution by Frequency Modulation Atomic Force Microscopy, Langmuir, 2009, 25 (5), pp 2850–2853
- K. Kimura, S. Ido, N. Oyabu, K. Kobayashi, Y. Hirata, T. Imai, H. Yamada, Visualizing water molecule distribution by atomic force microscopy, Journal of Chemical Physics, 132, 19, 194705 (2010).
- Kei Kobayashi, Noriaki Oyabu, Kenjiro Kimura, Shinichiro Ido, Kazuhiro Suzuki, Takashi Imai, Katsunori Tagami, Masaru Tsukada and Hirofumi Yamada, Visualization of hydration layers on muscovite mica in aqueous solution by frequency-modulation atomic force microscopy, Journal of Chemical Physics, 138, 184704 (2013).
- Takumi Hiasa, Kenjiro Kimura, Hiroshi Onishi, Masahiro Ohta, Kazuyuki Watanabe, Ryohei Kokawa, Noriaki Oyabu, Kei Kobayashi, Hirofumi Yamada, Aqueous Solution Structure over α-Al2O3 (0112) Probed by Frequency-Modulation Atomic Force Microscopy, J. Phys. Chem. C, 2010, 114 (49), pp 21423-21426
- Rina Nishioka, Takumi Hiasa, Kenjiro Kimura, and Hiroshi Onishi, Specific Hydration on p-Nitroaniline Crystal Studied by Atomic Force Microscopy, J. Phys. Chem. C, 117, 2939− 2943 (2013).
* All data on this page was obtained using the petri dish type solution cell (option).


