Qualitative Methods of GC/MS Analysis:Retention Time and Retention Index
Chromatographic Separation
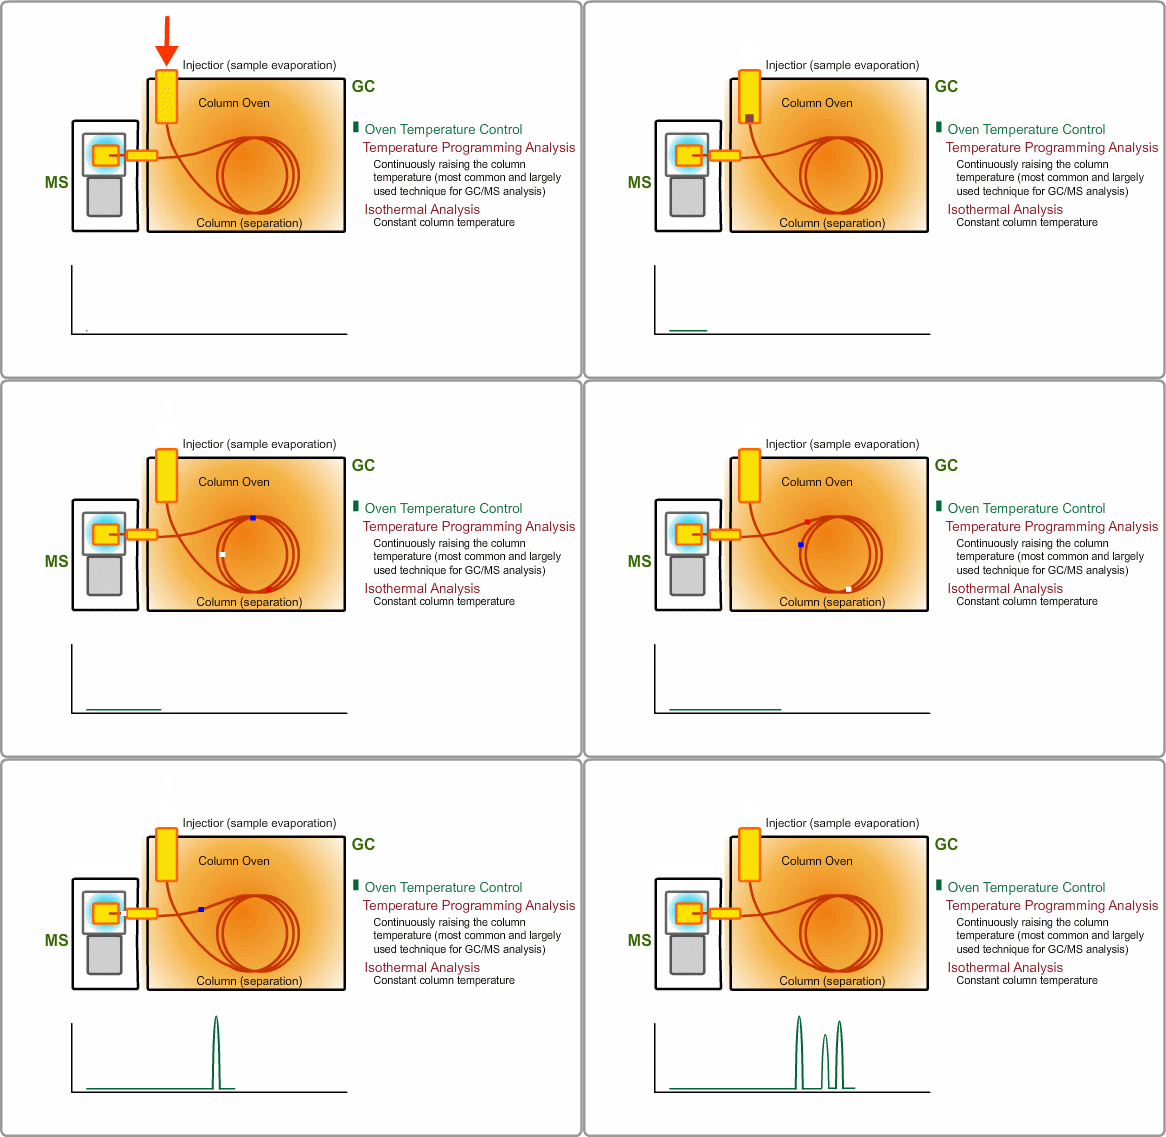
A gas chromatograph is an instrument which separates chemical components in a mixed sample by column. The sample is evaporated in an injector heated at about 200 to 300 °C. The evaporated sample transferred to a column is separated into each component during movingas it moves through it with carrier gas. A mass spectrometer is one of the GC detectors of GC.
Distribution Coefficient
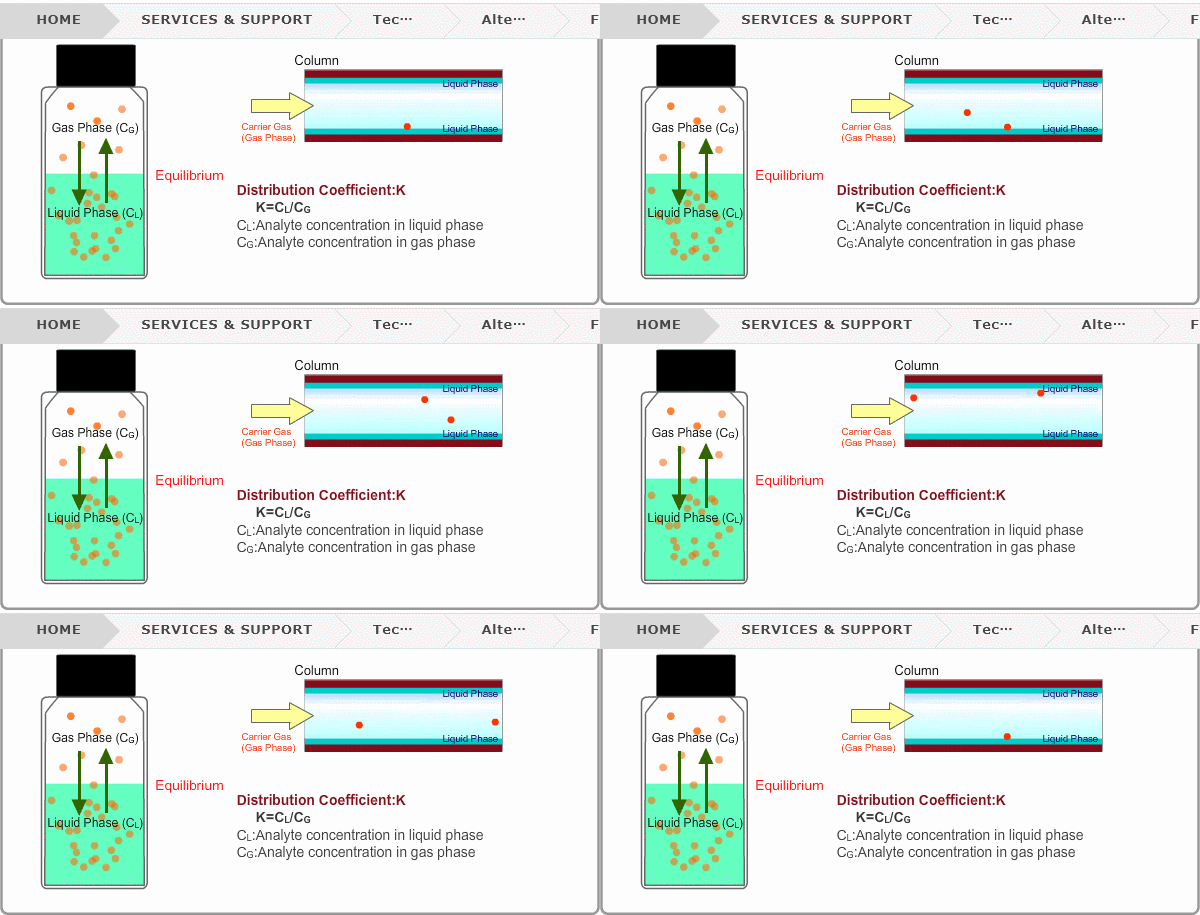
Roughly speaking, compounds with low boiling points tend to elute at short retention times. The distribution coefficient determines the order of elution from column. When you put liquid sample in a vial, the analyte evaporates from liquid phase (solvent) into gas phase, some of it returning to liquid phase. After a while, equilibrium will be achieved. Under this condition, the ratio K=CL/CG is constant without relation to analyte concentration. This ratio is called distribution coefficient. K depends on temperature. This notion can also be applied to column separation. There is a liquid phase (stationary phase) layer inside a column. Carrier gas corresponds to gas phase. A compound with larger K remains in the liquid phase for longer.
Retention Time Parameters
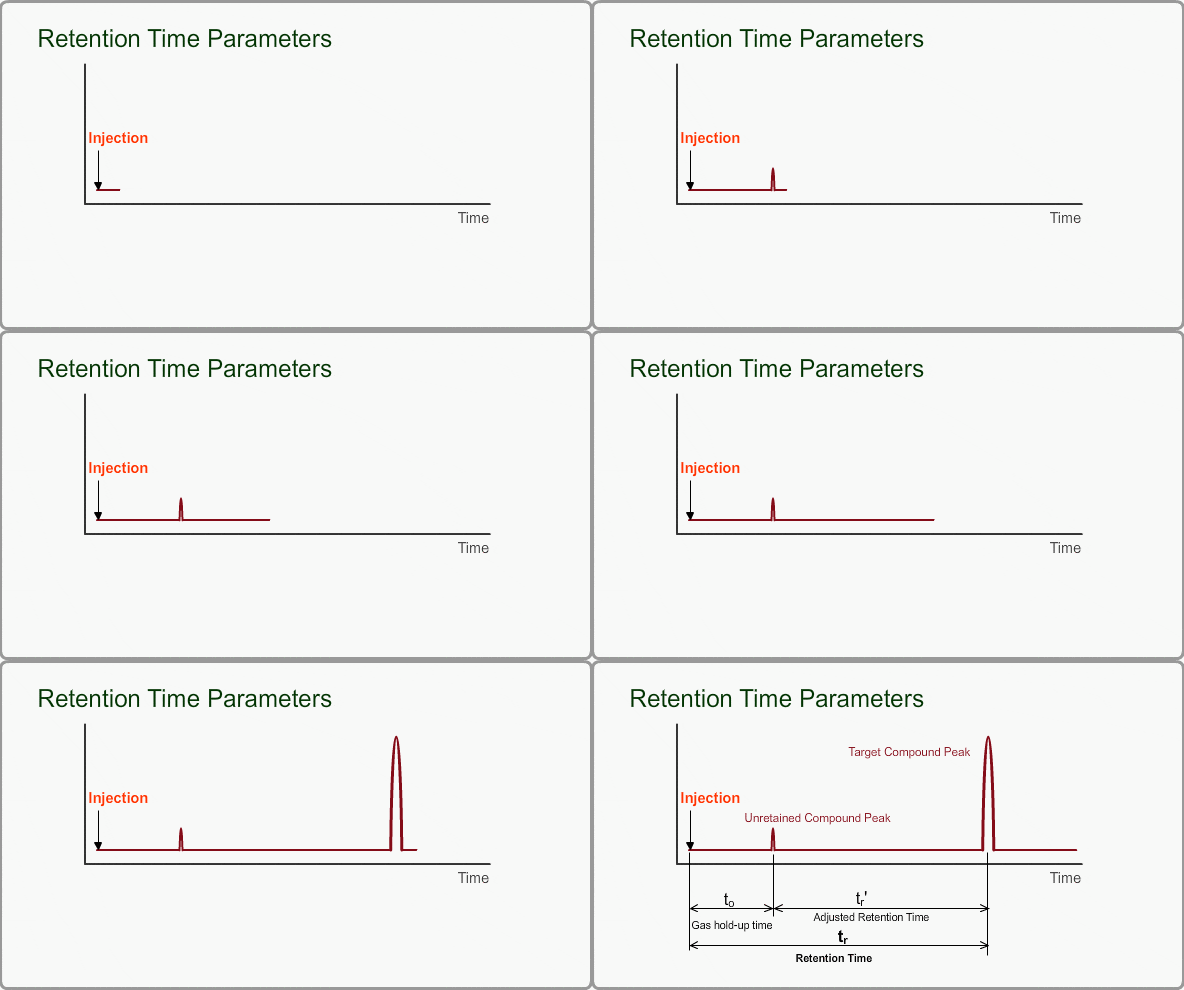
The retention time of a peak can be used as means of qualitative identification. The position of the target compound peak plays an important role in GC qualitative analysis. We call the length of time between injection and position of the target compound peak a retention time. On the other hand, the time difference between the peak of an unretained compound and a target compound is called the adjusted retention time. We call the retention time of a compound that is not retained by stationary phase the gas hold-up time. The hold-up time is directly measured as air peak for TCD measurement using a packed column, but air peak is not observed for a capillary column. The hold-up time can be indirectly estimated by using three peaks of n-alkane.
Factors Affecting Retention Time
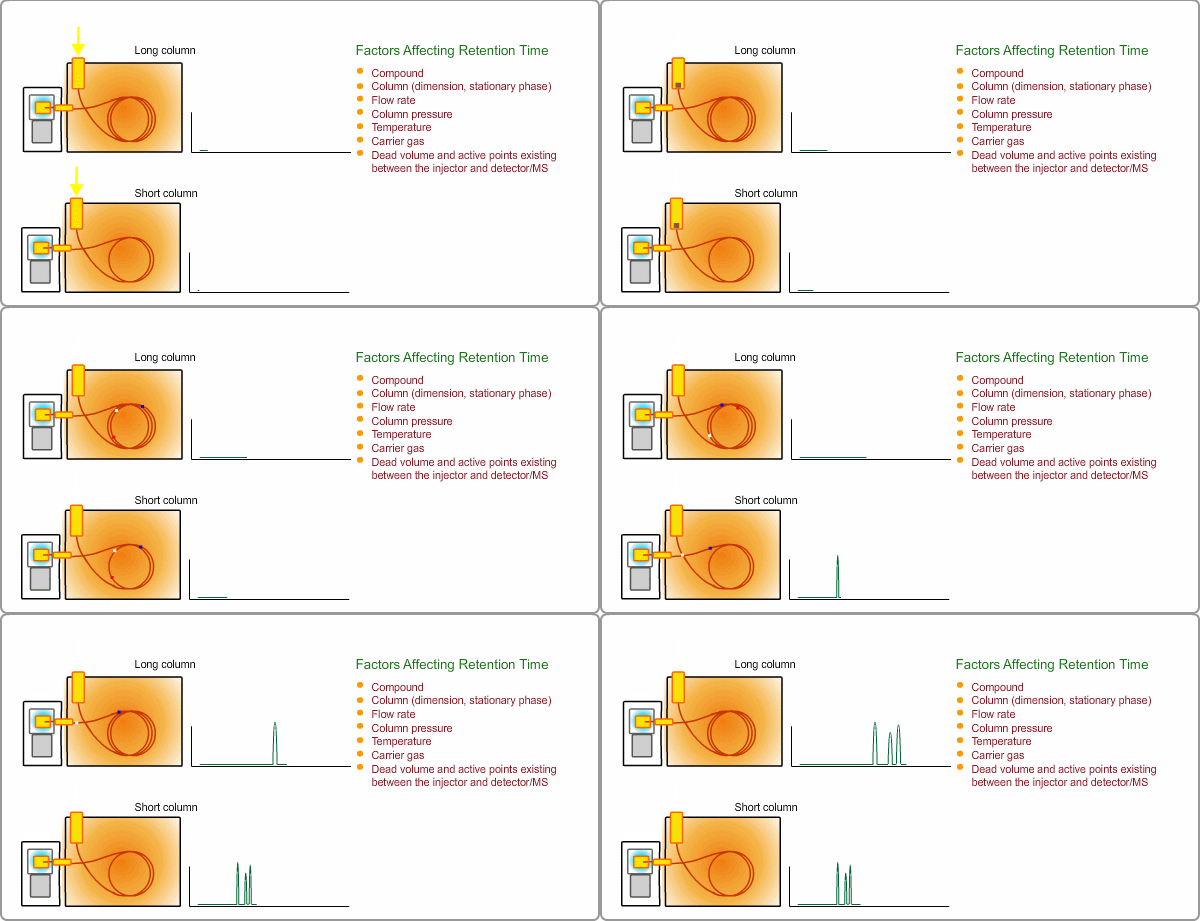
The retention time depends on many factors: analysis conditions, type of column, column dimension, degradation of column, existence of active points such as contamination. and so on. If citing a familiar example, all peaks appear at shorter times when you cut off part of column.
Qualitative Analysis by GC
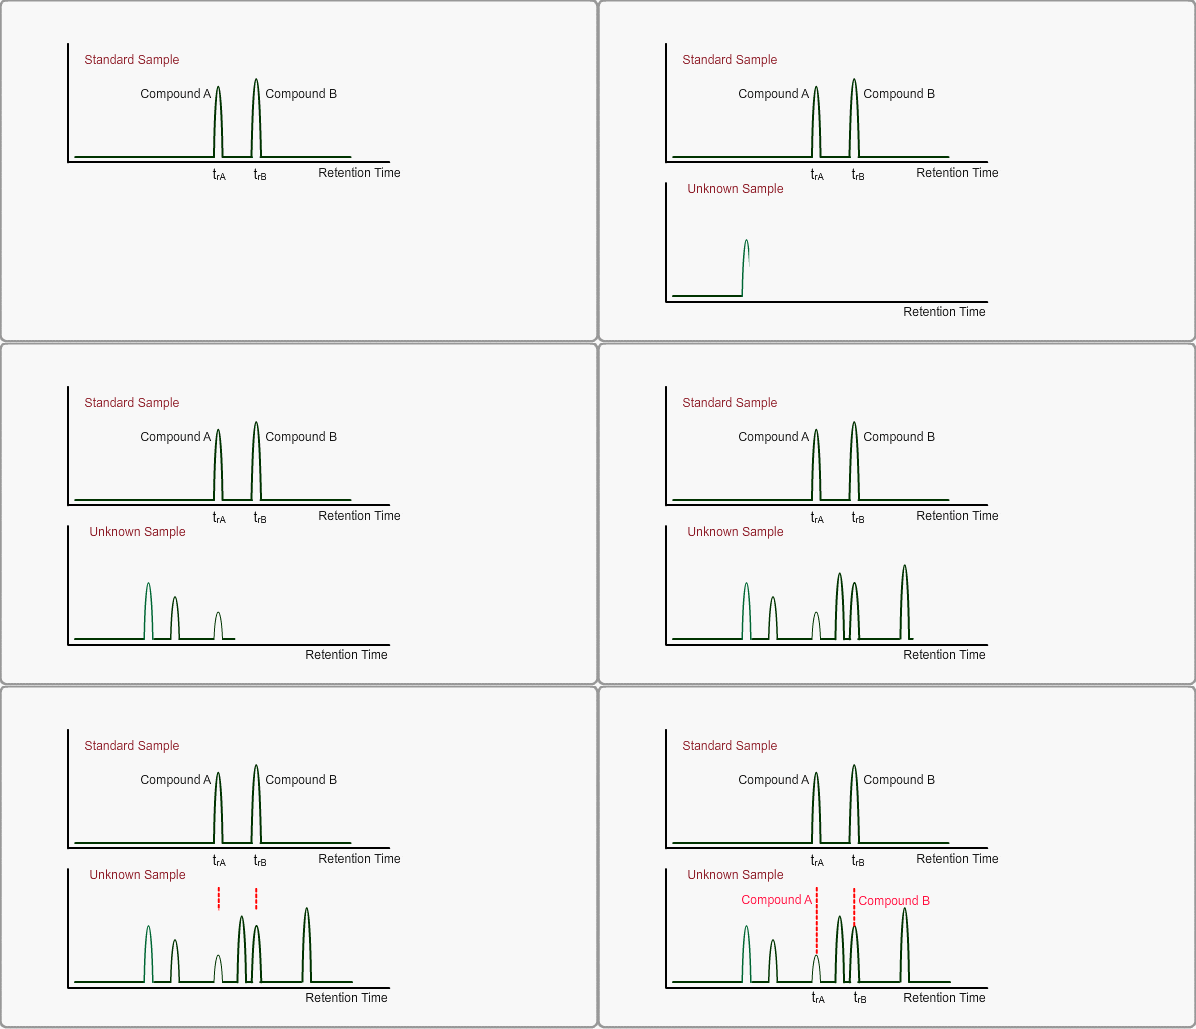
When measuring the same sample using same GC,column and same analysis method, you can expect the same chromatogram. If you measure unknown sample under these conditions, -the peaks of target compounds in unknown sample, if included, -can be identified by comparing the retention times of target peaks between standard sample and unknown sample.
Relative Retention
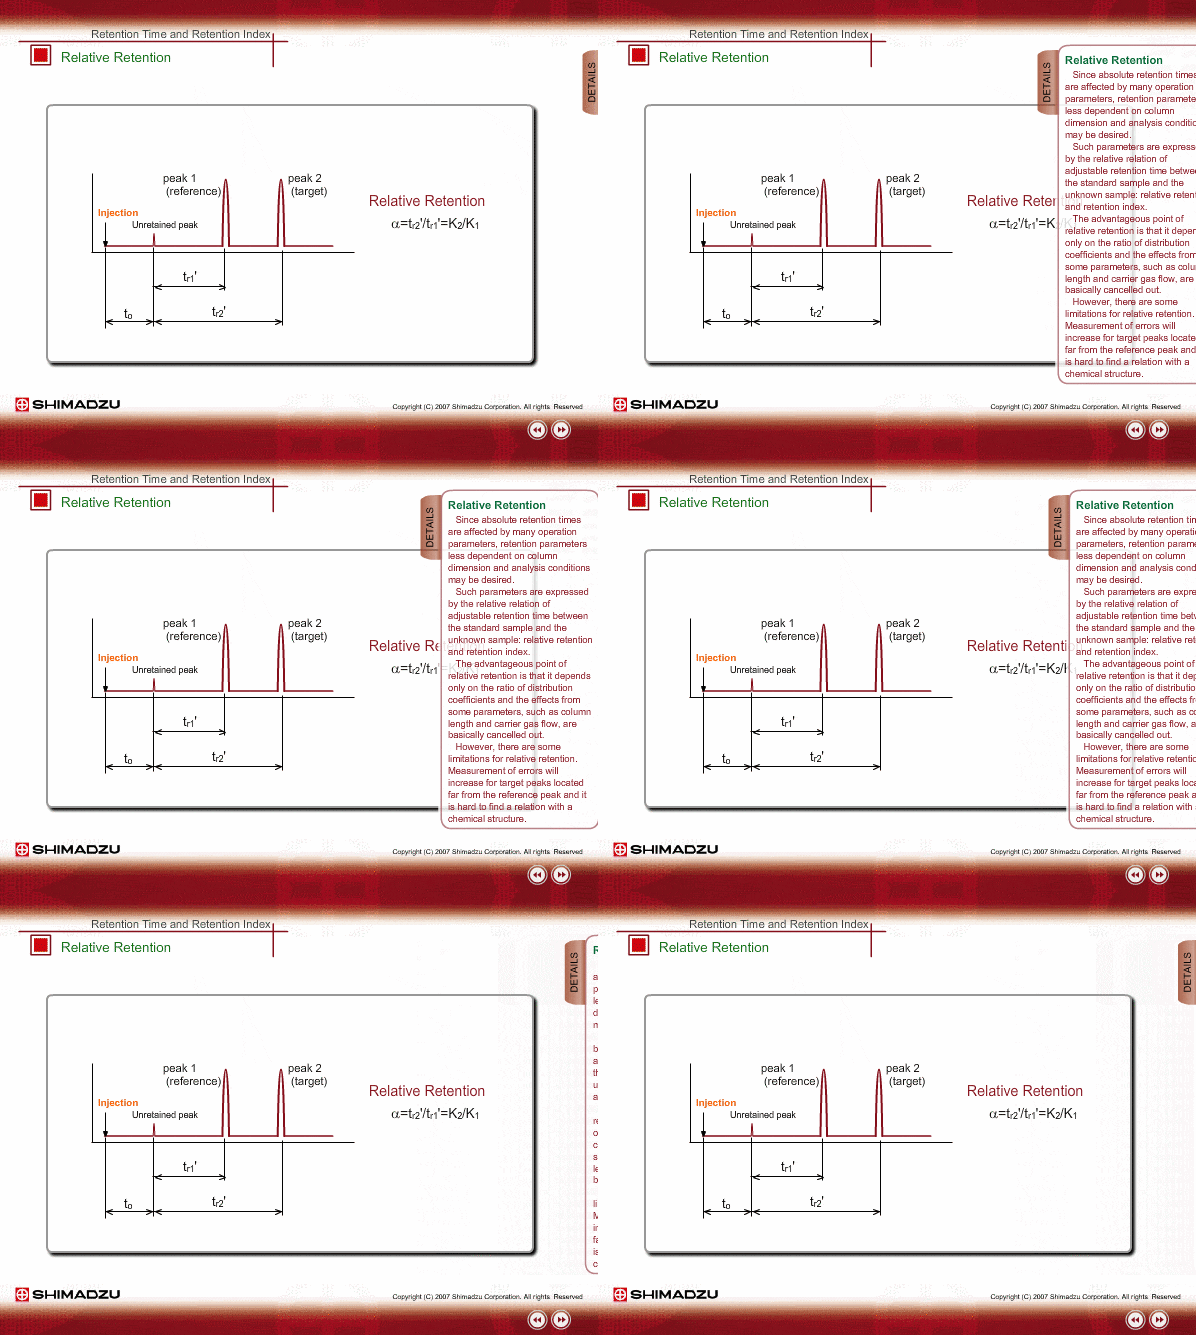
Since absolute retention times are affected by many operation parameters, retention parameters less dependent on column dimension and analysis conditions may be desired. Such parameters are expressed by the relative relation of adjustable retention time between the standard sample and unknown sample: relative retention and retention index.
The advantageous point of relative retention is that it depends only on the ratio of distribution coefficients, and the effects from some parameters, such as column length and carrier gas flow, are basically cancelled out.
However, there are some limitations for relative retention. Measurement errors will increase for target peaks located far from reference peak and it is hard to find a relation with a chemical structure.
Retention Index(Isothermal)
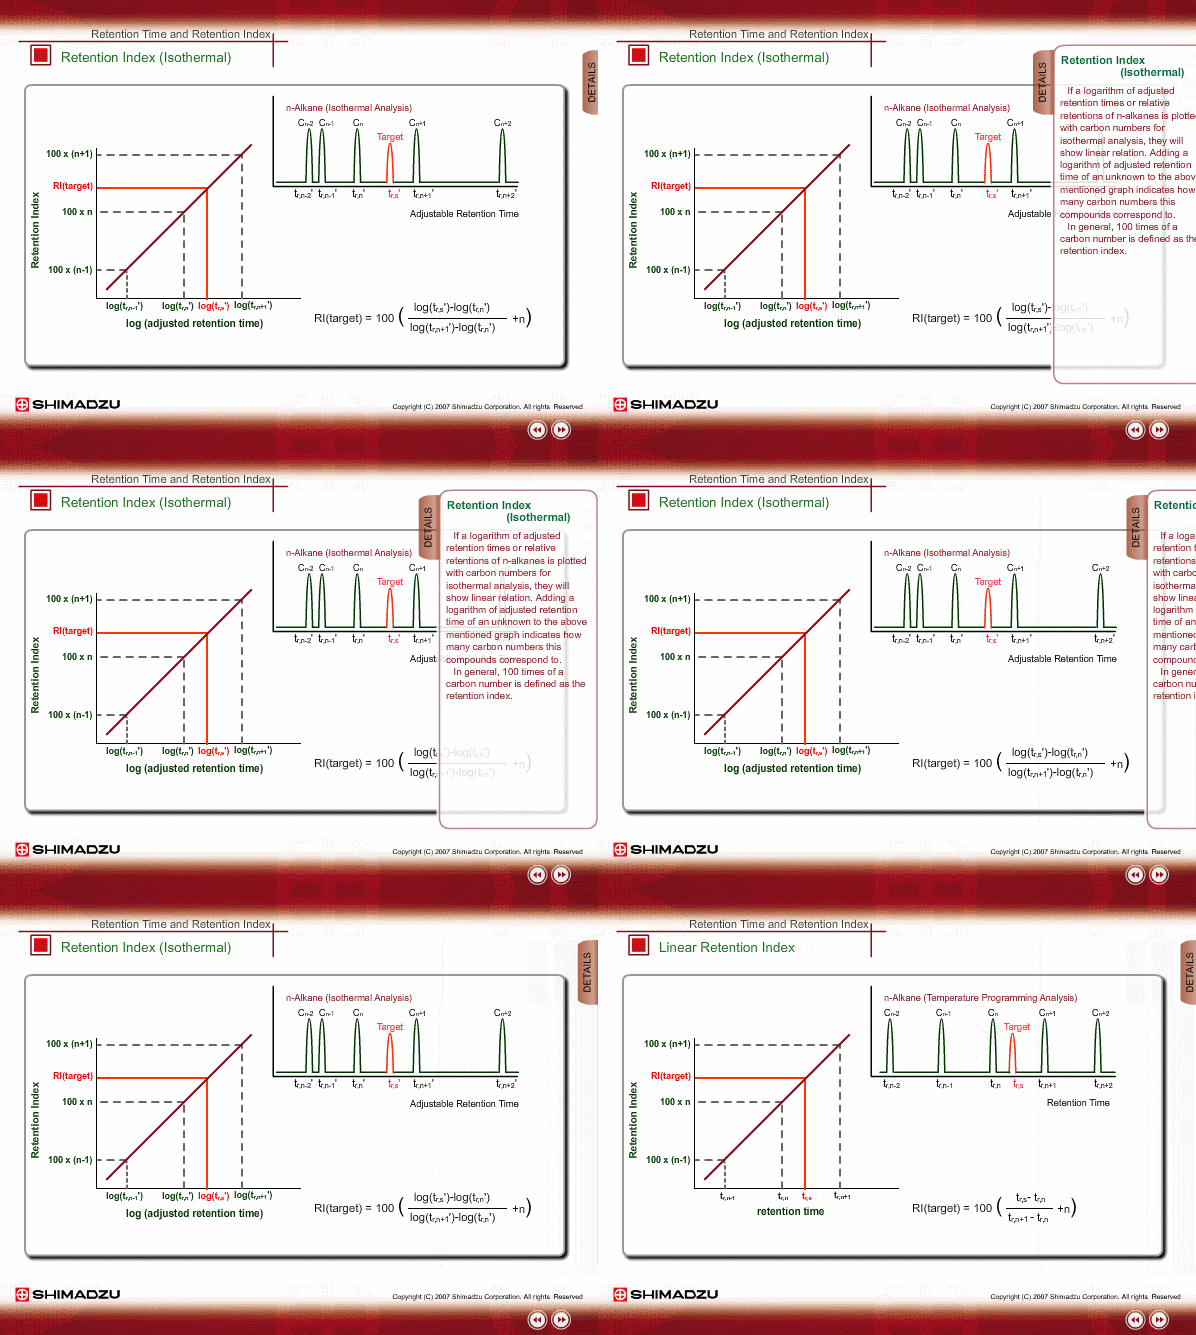
If a logarithm of adjusted retention times or relative retentions of n-alkanes is plotted with carbon numbers for isothermal analysis, they will show linear relation. Adding a logarithm of adjusted retention time of an unknown to the above~mentioned graph indicates how many carbon numbers this compound corresponds to. In general, 100 times of a carbon number is defined as the retention index.
Linear Retention Index(LRI)
On the other hand, the peaks of n-alkane appear at even intervals for temperature programming analysis. We call retention index obtained by temperature programming analysis linear retention index (LRI). LRI has advantageous points over retention index when using isothermal analysis. Calculation of retention index is simple, because logarithmic calculation is unnecessary. Additionally, we need not worry about estimating the gas hold-up time. Absolute retention times are sufficient for calculating the retention index.
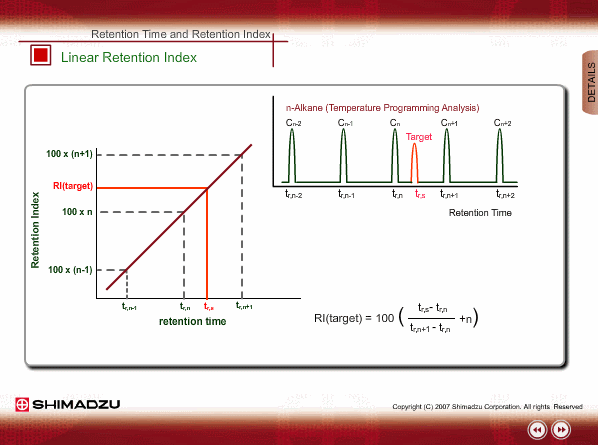
Identification Using LRI
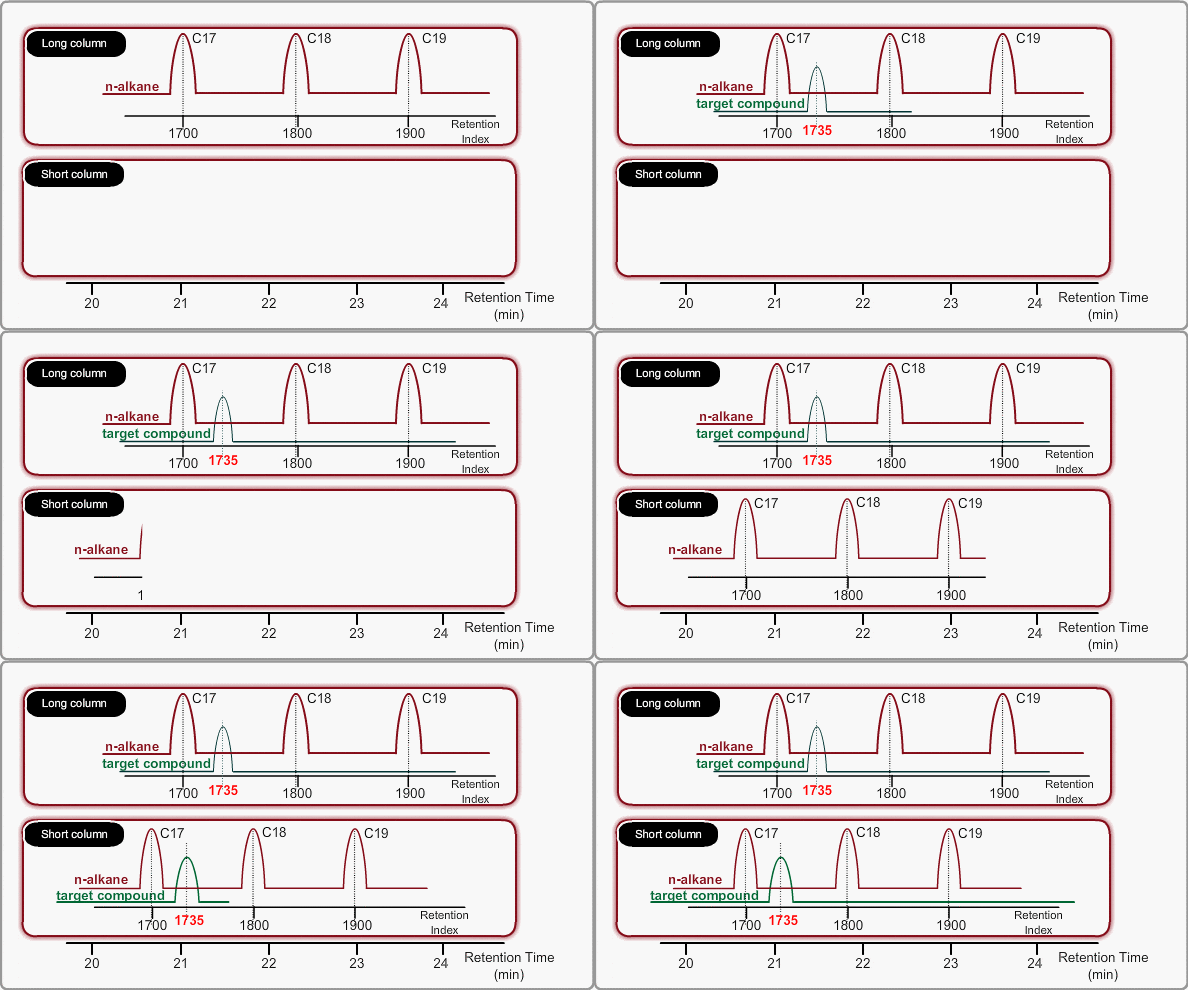
Using LRI improves accuracy of library search and makes adjustment of method file easy when cutting a column. When you use LRI, it is necessary to perform analysis of n-alkanes to relate retention indices to retention times. By using this relation, the retention index of a target peak is assigned. -Taking the column cut shown in the figure, you will find a target peak at the expected retention time after cutting the column.
