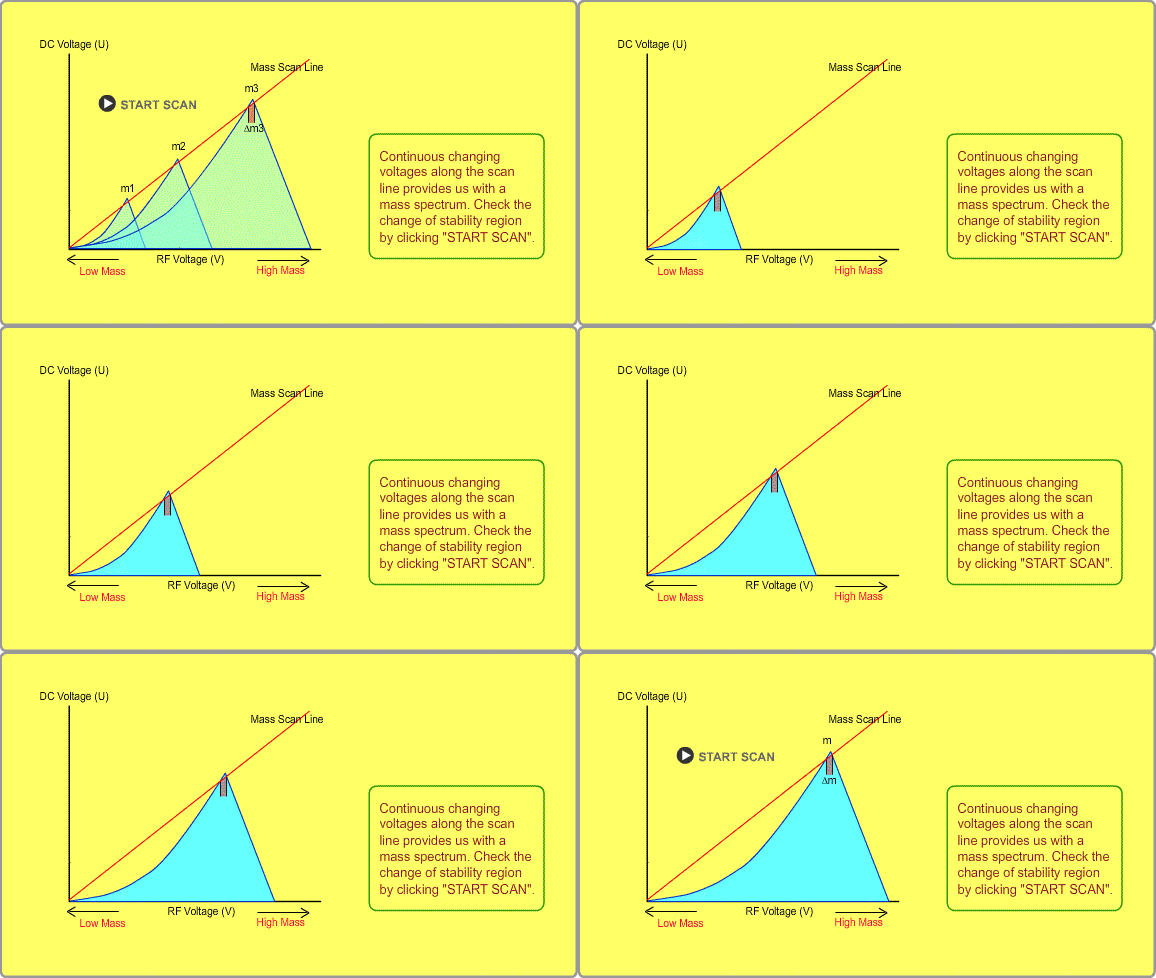
Stability Region and Scan Line
The stability diagram can be drawn using a RF voltage axis and a DC voltage axis in place of a and q. For a given mass number m, applying RF voltage V and DC voltage U in the stable region enables the ion to pass through the rod. Usually, for a QP mass filter, V and U are changed, keeping their voltage ratio constant, which is shown in the left figure. This line is called the mass scan line.
Though you set a voltages, not m3, in the range of Dm3, the m3 ion also goes through the rod. The mass resolution can be changed by changing the slope of the scan line and shifting the line upward or downward.

Top >> Hardware: Mass Analyzer


