Fundamentals of LC, MS and LCMS
Liquid chromatography (LC) is a separation technique, first demonstrated in the early 1900s by Russian botanist, Mikhail Semyonovich Tswett. LC separates the components of a sample based on the differences in their affinity or retention strength for the stationary phase and mobile phase. This separation is illustrated in Figure 1 where the components in the sample are separated in a LC column.
There are different techniques of LC available and the principles of retention and separation of each of the LC technique differs. Table 1 presents a list of the common LC techniques and their separation mechanism. With current advancements in LC, it has evolved into technologies of smaller particle sizes and higher pressure that are more efficient and of higher speed, sensitivity and resolution such as the high-performance liquid chromatography (HPLC) and the ultra-high-performance liquid chromatography (UHPLC).

Figure 1. An illustration of how LC works. The sample (in purple) is injected into the LC column and gets separated into 2 analyte bands (red and blue) and gets eluted from the column.
| Type of LC Techniques | Separation Mechanism | Commonly used for |
|---|---|---|
| Reversed-Phase LC (RPLC) | A non-polar stationary phase and a polar mobile phase is used for RPLC. Based on the "like attracts like" principle, the sample is separated based on the molecule's polarity preference to either the polar mobile phase or the non-polar stationary phase. For example, the non-polar molecules will prefer to retain in the non-polar stationary phase rather than the polar mobile phase. As a result, it gets eluted later compared to the polar molecules. | Low molecular weight (MW) compounds |
| Normal Phase LC (NPLC) | NPLC works entirely opposite to RPLC. In NPLC, a polar stationary phase and a non-polar mobile phase is used. Polar molecules are strongly retained by the stationary phase as compared to the non-polar molecules. As a result, the non-polar molecules elute first. | Steroid hormones, phospholipids, saccharides and tocopherols |
| Hydrophilic Interaction Liquid Chromatography (HILIC) | HILIC works on the same principle as NPLC. The main difference is that water is added in the organic mobile phase to effectively separate and elute the strongly-retained polar molecules. | Polar compounds |
| Ion Exchange Chromatography (IEC) | IEC retains and separates charged species (ions) based on electrostatic affinity of the analyte for the stationary phase containing a functional group of an opposite charge. Differential elution is induced either by changing the pH of the mobile phase to neutralize the analyte, or by increasing the ionic strength (salt concentration) to competitively displace the analyte. | Proteins, amino acids, nucleotides, and inorganic ions |
| Size Exclusion Chromatography (SEC) | The SEC column used is filled with porous particles. When sample of various sizes flow into the column, smaller molecules migrate more slowly because they penetrate deep into the pores, whereas large molecules flow quickly as they do no enter the pores as much. As a result, larger molecules elute from the column sooner, which effectively sorts the samples by molecular size. | Proteins and synthetic high polymers |

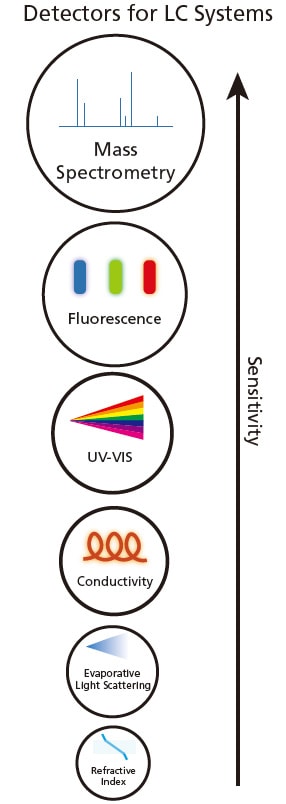
Figure 2. Various detectors for LC systems in increasing sensitivity.

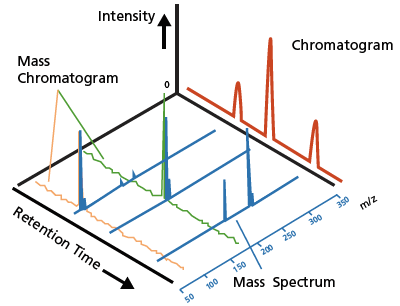
Figure 3. A typical LC chromatogram (red) and a LCMS mass chromatogram and mass spectrum (blue).
Upon separation by LC, the components can be detected using optical properties such as ultraviolet-visible (UV-VIS), fluorescence, refractive index, evaporative light scattering or electrical conductivity based on the analytes' properties. Figure 2 shows the various detectors for LC. When the analyte passed through the detector, a change (e.g. increase or decrease) in the optical property will be observed and recorded.
Chromatograms obtained using these optical detectors primarily identify or qualify substances based on the retention time and quantitate substances based on the peak area and intensity. The LC chromatogram (Figure 3, in red) shows an example of a typical chromatogram obtained using these optical detectors. LC coupled with optical detection offers great quantitative accuracy for analytes that can be chromatographically resolved, where a detected peak comprises only a single component. However, achieving required resolution is challenging for complex samples where multiple components elute approximately at the same time.
In contrast, mass spectrometry (MS) offers a highly sensitive detection technique that ionizes the sample components, separates the resulting ions in vacuum based on their mass-to-charge ratios (m/z) and measures the intensity of each ion. A mass spectrum plots the relative ion intensities against the m/z values, and a series of mass spectra are generated at each time point (Figure 3, in blue). This information indicates the concentration level of ions that have a given mass and is extremely valuable for the unique identification of molecules, also known as qualitative analysis. Moreover, MS provides added specificity and sensitivity, and the convenience of simultaneous multicomponent analysis.
With the coupling of LC with MS, the mass spectra obtained from these measurements provide molecular mass and structural information for eluted components, which supplement the qualitative information based on retention times obtained using other LC detectors. Therefore, LCMS combine the outstanding separation resolution of LC with the excellent qualitative capabilities of MS.


