Preparing the Mobile Phases
-Differences in Preparation Method May Result in Different Chromatograms -

A water-based solvent, organic solvent, or a mixture of the two is mainly used as the mobile phase for HPLC. A buffer solution is often used as the aqueous solvent. LCtalk38 LAB Preparing Buffer Solutions describes the actual preparation methods for typical buffer solutions used with HPLC. However, it seems that many people have a vague understanding of buffer solutions.
If the preparation method is not the same as the method described in the material for the analysis method, differences can occur in the mobile phase that affect the chromatograms and analysis results. Apart from the buffer solution, many other unforeseen factors affect the mobile phase preparation, such as the method of mixing the solvent.
Here, we use actual examples to consider the effects of the mobile phase preparation method on the analysis results.
1) Preparing Buffer Solutions
In practice, how do we go about preparing a buffer solution that is denoted as "20 mM phosphoric acid buffer solution (pH=2.5)"? Let's examine a few possible issues.
First, we know that it is a phosphoric acid buffer solution, but what is the counterion? If sodium ions are unambiguously the counterion, does "20 mM" refer to the phosphoric acid concentration or the sodium phosphate concentration?
For a 20 mM phosphoric acid (sodium) buffer solution, "20 mM" could be considered to be the phosphoric acid concentration. On the other hand, considering "20 mM" to be the sodium concentration, the buffer solution could be a buffer solution prepared by adjusting the pH using a 20 mM aqueous solution of sodium dihydrogen phosphate. (However, a 20 mM aqueous solution of sodium dihydrogen phosphate has a pH just under 5, so that pH adjustment with some type of acid is required to achieve pH 2.5.)
However, an ion-pair effect due to the acid used for pH adjustment could affect the analysis results. This is potentially dangerous, as it leads to several possible interpretations of a denoted buffer solution.
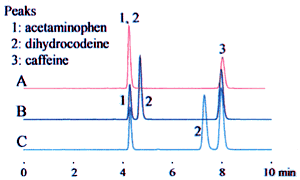
The example above leads to three potential interpretations. Fig. 1 shows how this affects the analysis results.
In the top row, "20 mM" is interpreted as the phosphoric acid concentration. The analysis results were obtained using a solvent prepared as "20 mM phosphoric acid (sodium) buffer solution (pH 2.5)" as the mobile phase.
In the middle and bottom rows, "20 mM" is interpreted as the sodium dihydrogen phosphate concentration. The mobile phase was prepared by adding phosphoric acid or perchloric acid to adjust the pH to 2.5.
These differences can significantly affect the retention time, as shown for dihydrocodeine in the example, and can lead to problems with the robustness of the analysis method. Clearly identifying the buffer solution when specifying the preparation method can prevent problems due to differences in interpretation.

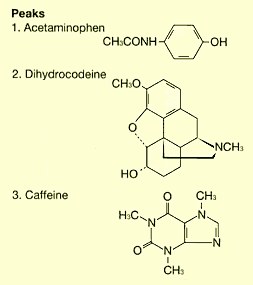
1. Acetaminophen 2. Dihydrocodeine 3. Caffeine
| Column | Shim-pack VP-ODS (150 × 4.6 mm I.D.) | |
| Mobile phase | Buffer solution (pH 2.5) / acetonitrile = 9 / 1 | |
| Top row A | 20 mM phosphoric acid (sodium) buffer solution (pH 2.5) | |
| Middle row B | 20 mM sodium dihydrogen phosphate buffer solution (pH2.5); phosphoric acid added to adjust the pH | |
| Lower row C | 20 mM sodium dihydrogen phosphate buffer solution (pH 2.5); perchloric acid added to adjust the pH | |
| Flowrate | 1.0 mL/minute | |
| Temperature | 40 °C | |
| Detection | 210 nm | |
2) Mixing Organic Solvents and Water-Based Solvents
A mixed solution of organic solvents and aqueous solvents is often used as the mobile phase. The way that they are mixed can cause large differences in analysis results. Consider an example of 90 % buffer solution and 10 % acetonitrile. (The buffer solution is 20 mM sodium dihydrogen phosphate adjusted to pH 2.5 by the addition of phosphoric acid.) A mixing ratio of 9:1 can be interpreted as a 9:1 volume ratio of buffer solution and acetonitrile. That is, the equivalent volumes are measured and mixed together.
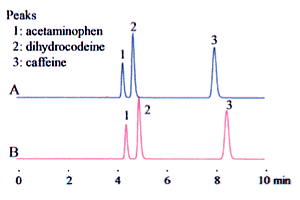
On the other hand, it is possible to interpret this as 10 % acetonitrile content, that is, that the acetonitrile must be diluted ten times with buffer solution. This results in a reduced volume due to mixing, such that surplus buffer solution is added. It may be felt that there is no great difference between the two. Care is required, as the type of mixing can have a remarkable effect on the analysis results (in particular, the retention time), as shown in Fig. 2.
Generally, when preparing the mobile phase for high-performance liquid chromatography, the proportion is often denoted as Liquid A : Liquid B = 3 : 2 (V/V). That is, the equivalent of volume ratio 3 of Liquid A and the equivalent of volume ratio 2 of Liquid B are measured separately and mixed together. (In practice, this results in a mixture volume slightly less than the equivalent to theoretical total "5" for the two liquids (3 + 2).)
The problem above also relates to the preparation of sample solutions and other solutions, not only to the preparation of mobile phase.
Each field (such as pharmaceuticals and chemical engineering) has its own conventional wisdom and customs, which causes even more confusion. Keep in mind to always use appropriate indications to avoid confusion. If uncertainty arises, consult an official compendium, such as the Japanese Pharmacopoeia, Standard Methods of Analysis for Hygienic Chemistry, Japanese Industrial Standards (JIS), which cover rules and regulations for the preparation of solutions.
(J.Ma)

1. Acetaminophen 2. Dihydrocodeine 3. Caffeine
| Column | Shim-pack VP-ODS (150×4.6 mm I.D.) | |
| Mobile phase | Top row A | 9:1 (v/v) mixture of buffer solution and acetonitrile |
| Lower row B | Make up to 10 % (v/v) acetonitrile with buffer solution. The buffer solution is 20 mM sodium dihydrogen phosphate adjusted to pH 2.5 by the addition of phosphoric acid. |
|
| Flowrate | 1.0 mL/minute | |
| Temperature | 40 °C | |
| Detection | 210 nm | |
Fig. 2 Effects of Mobile Phase Preparation Method


